Pyqtrader Introduction
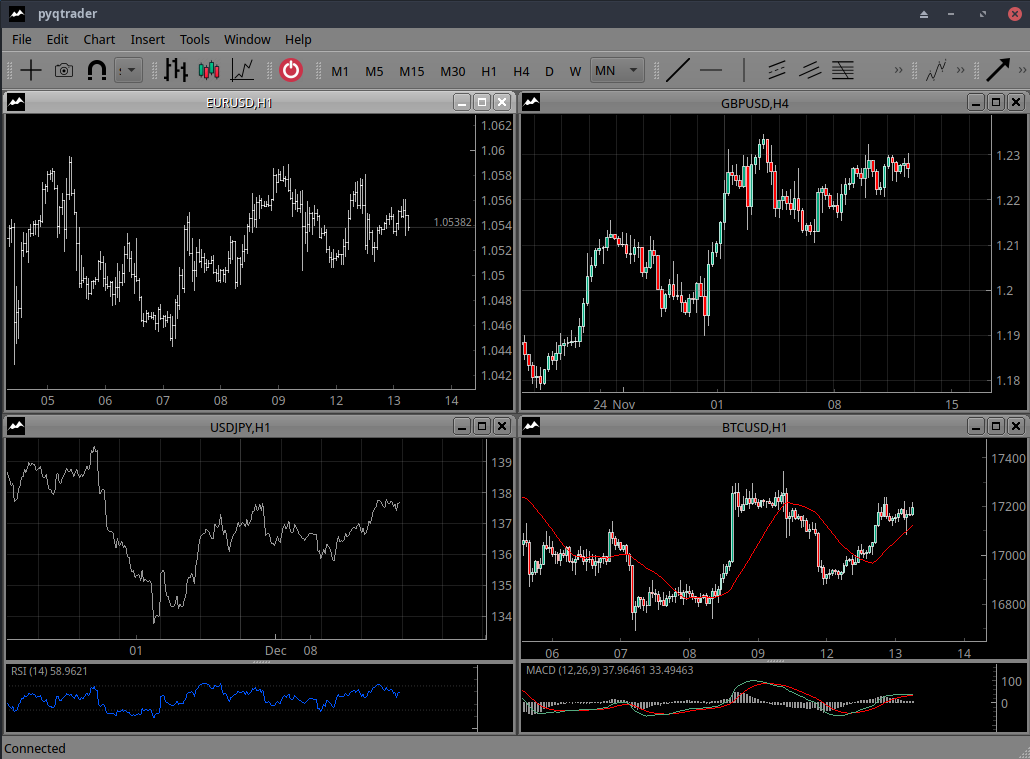
We are pleased to introduce pyqtrader, our analytical trading application:
The key features include:
- Linux-based
- Python compatibility
- Algo-trading and analytics visualization
- Transferable charts
- Responsive interface
- Portability
- Scalability and modularity
- Variety of embedded tools, including Elliott Wave labeling
Consult Youtube HowTo’s to explore pyqtrader.
Download from our GitHub.
Cross-platform design
Pyqtrader can be natively run on:
- Linux Arch
- Linux Debian 11+
- Linux Fedora 36+
- Linux Ubuntu 22.04+
Other Linux distributions have not been tested but should be able to run pyqtrader as long as they are reasonably up-to-date. No translation layer is required.
Python compatibility
Traders and coders are able to connect their own python code to pyqtrader via the latter’s API in order to obtain trading data, visualize trading analytics and execute trading strategies. No proprietary scripting is required.
Algo-trading and analytics visualization
Traders can design their own Scripts, Indicators and Trading Bots and integrate them into pyqtrader using regular python code and pyqtrader’s API.
Transferable charts
The charts can be saved, stored, sent as attachments and opened just like ordinary text documents. This can be particularly useful for teams or groups where a trade is desired to be made from a readily available chart and time is at a premium. View in HowTo’s.
Responsive interface
The charts can be very swiftly and smoothly scrolled, zoomed in and zoomed out via simple mouse interactions.
Portability
The application is ready to use, no installation is required.
Scalability and modularity
Pyqtrader can be enhanced by additional modules via its API.
Variety of embedded tools
Pyqtrader has a constantly growing set of readily available functionality, such as MACD, RSI, Stochastic and other indicators, labeling scripts, Fibonacci, trendline and Elliott Wave tools, profile system, non-standard timeframes and so on. The user interface and individual charts can be styled, themed and colored to the user’s liking.
Download from our GitHub.
